Assistant Professor
Pediatric Nephrology
Washington University School of Medicine in St. Louis
Normalizing the percent donor derived cell free DNA (dd-cfDNA) to recipient body surface area (BSA) or to donor to recipient BSA ratio: effects on the diagnostic performance in detecting acute transplant rejection
Raja Dandamudi1, Leslie Walther1, Vikas R. Dharnidharka1.
1Pediatrics, Washington University School of Medicine in St. Louis, St. Louis, MO, United States
Purpose: Cell-free DNA (cfDNA) is constantly released into circulation from cell injury or senescence. In organ transplantation, the donor-derived fraction (dd-cfDNA), expressed as percentage of the total (including background and donor-derived) circulating DNA fragments, has been clinically associated to acute rejection. Background cfDNA may increase with higher body mass index due to increased inflammation and with increasing age due to accelerated cell senescence, but it may also be lower in pediatric patients with lower cell turnover. We determined if normalization of dd-cfDNA values to recipient or donor body size would improve the diagnostic performance of dd-cfDNA in detecting T-cell mediated rejection (TCMR) after kidney transplantation to children.
Methods: We accessed a biobank of 54 children at our center with longitudinally collected and banked plasma samples monthly, prior to the biopsy (both surveillance and for cause biopsies). We quantified dd-cfDNA in plasma by next generation sequencing using a targeted, multiplex PCR-based method for the analysis of single nucleotide polymorphisms (AlloSure, CareDx). Donor BSA and recipient BSA at the time of transplant were extracted from the UNOS data base. We adjusted the % dd-cfDNA results for body size in 2 different ways: a) to the recipient only BSA (%dd-cfDNA x [1.732/recipient BSA in m2]); and b) to the donor/recipient BSA size mismatch ([%dd-cfDNA/[donor/recipient BSA in m2]).
Results: For this analysis we studied 109 samples ofdd-cfDNA levels drawn on the same day prior to kidney biopsies within the first year post-transplant from 54 unique patients. 92 (84%) were surveillance biopsies, 17 (16%) were performed for clinical suspicion of rejection. All other pathologies were excluded, and we had ABMR events in our cohort. Treating each sample as independent, we analyzed the 109 plasma samples as two groups (no evidence of TCMR, versus any TCMR, including subclinical rejection). We had 27 biopsy specimens from 22 patients with acute rejection, and 82 biopsy specimens from 45 patients without acute rejection. At biopsy proven acute rejection, the donor derived cfDNA level median (IQR) level was significantly higher at 0.91% (0.54-1.2%) than the non-biopsy proven acute rejection group (median 0.22%, IQR 0.14-0.45%; P < 0.001 by Mann-Whitney U test). The area under the receiver-operating characteristic curve for % dd-cfDNA value was 0.82 (95% CI 0.71 to 0.93; Figure). The area under the receiver-operating characteristic curve value for recipient BSA normalized % dd-cfDNA was 0.79 (0.67 to 0.91). The area under the receiver-operating characteristic curve value for % dd-cfDNA normalized for donor:recipient BSA was 0.73 (0.61 to 0.84).
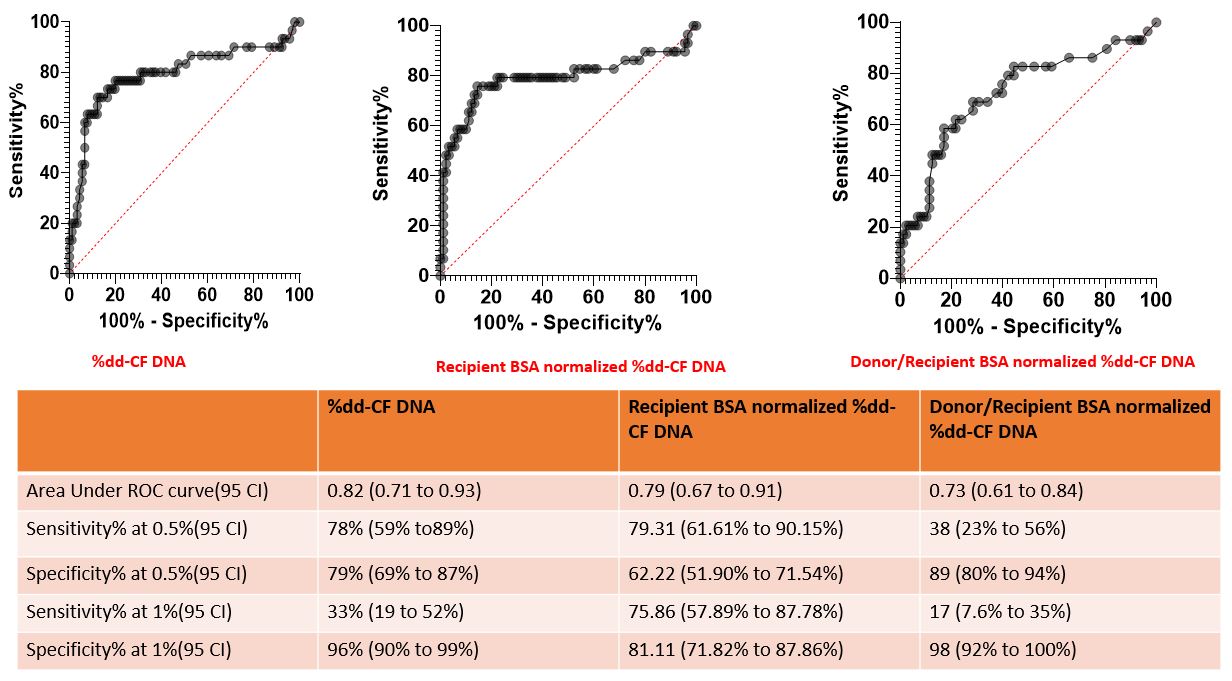
Conclusions: In our pediatric cohort, normalizing the % dd-cfDNA to recipient BSA or to donor:recipient BSA ratio did not improve the diagnostic performance for TCMR. Future studies to investigate the performance of absolute dd-cfDNA levels (copies/ml) are warranted