
Impact of donor-to-recipient body surface area ratio on the plasma donor derived cell free DNA longitudinal kinetics in the first year in stable pediatric kidney transplant recipients
Raja Dandamudi1, Leslie Walther1, Vikas Dharnidharka1.
1Pediatrics, Washington University School of Medicine in St. Louis, St.Louis, MO, United States
Purpose: In adult studies, the levels drop to a mean of 0.46% (± 0.21%) approximately 10 days after transplantation. Our aim was to determine if children would have similar kinetics and to evaluate the effect of donor/recipient body surface area ratio (D/R BSA) as an indicator for size mismatch between the donor and recipient on this kinetics.
Methods: We accessed a biobank of 57 children with longitudinally collected and banked plasma samples monthly, drawn between 30 days and 12 months post-kidney transplant from 2013 onwards. We quantified dd-cfDNA in plasma by next generation sequencing using a targeted, multiplex PCR-based method for the analysis of single nucleotide polymorphisms (AlloSure, CareDx, Brisbane, CA). A subgroup of 237samples from 54 stable renal transplant recipients with no major infectious events, rejection events or delayed graft function were identified to study the dd-cfDNA kinetics over time.
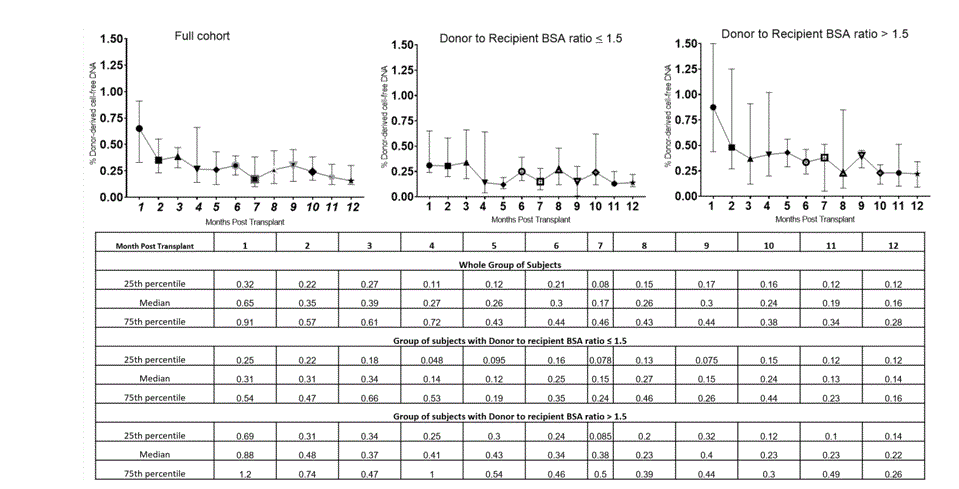
Results: In this cohort, the median (IQR) plasma % donor derived cfDNA at 30 days post-kidney transplant was 0.65% (0.32 – 0.91 %), decreasing to 0.35% (0.22 - 0.57%) by month 2, to a median of 0.17 (0.08 - 0.46 %) by month 6 and to a median of 0.16 (0.12-1.28%) by month 12 post-transplant. Using donor/recipient body surface area ratio (D/R BSA) as an indicator for size mismatch between the donor and recipient we stratified the subjects into two groups (D/R BSA < 1.5 vs D/R BSA > 1.5). In comparison to the D/R BSA < 1.5 group (120 samples), the D/R BSA >1.5 group (117 samples) had a higher mean % donor derived cfDNA through the entire first year post-transplant. In the D/R BSA > 1.5 group the median % donor derived cfDNA did not reach <0.3% till 8 months post-transplant whereas in the D/R BSA < 1.5 group the mean % donor derived cfDNA reached < 0.3% by 4 months post-transplant.
Conclusions: In our pediatric cohort, the time required for initial stabilization post-transplant was significantly longer. We believe that the size disparity between the allograft and recipient, and lower levels of circulating recipient cell free DNA in younger is contributing to this disparity. To support this concept, in our cohort when there is greater disparity between the donor and recipient (D/R BSA >1.5), there was greater mean % donor derived cfDNA in the entire first year post transplant when compared to D/R BSA < 1.5 group. These findings point toward the possible need for normalization of % dd-cfDNA values with respect to donor/recipient body surface area ratio.